
4. Managing Data Attributes
Attributes for vector data are stored in a table. (In a
Shapefile vector format, this is contained in a separate file with dbf
extension). A table is like a spreadsheet. Each column in the table is called a
field. Each row in the table is a record. Each of the records in the attribute
table in a GIS corresponds to one feature. The application “links” the attribute
records with the feature geometry so that you can find records in the table by
selecting features on the map, and find features on the map by selecting features
in the table. Each field in the attribute table contains contains a specific type
of data such texts, numbers or date.
4.1. Viewing Data Attributes
In QGIS you can easily view data attributes by either selecting the feature within the layer of interest or opening the full table.
1. To display the attribute table , select the Administrative boundaries
layer in Map Legend panel. In the Menu, select
 Identify Features. Or just
click the Identify Features in the toolbar.
Identify Features. Or just
click the Identify Features in the toolbar.
2. Click on any polygon in the map to show the feature attributes.

3. To view the attribute table similar to a spreadsheet, select the
Administrative boundaries layer in the Map Legend.
Right-click the layer and select Open Attribute Table.

4. A new window will appear showing the full table of the data layer. You can browse and edit the attribute table within this window.
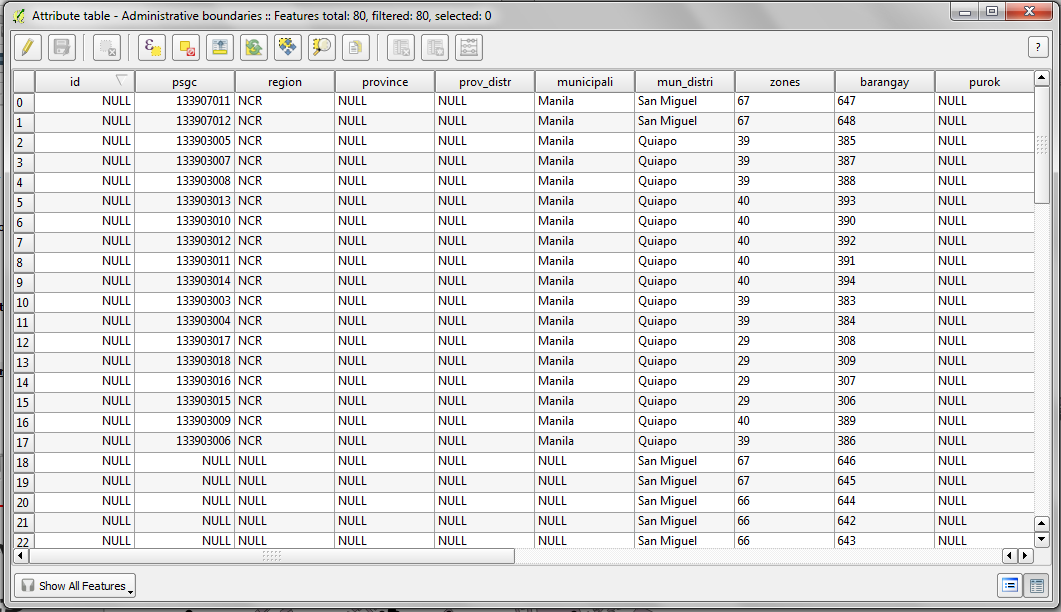
A full explanation of the tools within the Attribute table window is presented below:
 Unselect All - Remove selection from
previous selected records
Unselect All - Remove selection from
previous selected records Move Selection to Top - Move the selected
records to the top of the table
Move Selection to Top - Move the selected
records to the top of the table Invert Selection - Invert selection
 Copy Selected Rows - Copy selected rows to
clipboard
Copy Selected Rows - Copy selected rows to
clipboard Zoom Map to Selected Rows - Zoom map to
selected rows
Zoom Map to Selected Rows - Zoom map to
selected rows Toggle Editing Mode - Toggle editing mode to
edit single values of attribute table and to enable functionalities described
below.
Toggle Editing Mode - Toggle editing mode to
edit single values of attribute table and to enable functionalities described
below. Delete Selected Features - Delete selected
features
Delete Selected Features - Delete selected
features New Column - This adds a new column in the
attribute table. You will be asked to provide attribute details in a new
window (name, field type, etc.).
New Column - This adds a new column in the
attribute table. You will be asked to provide attribute details in a new
window (name, field type, etc.). Delete Column - Delete column (only for
PostGIS layers yet)
Delete Column - Delete column (only for
PostGIS layers yet) Open Field Calculator - Open field
calculator to update attribute data based on arithmetic, logical and other
calculations
Open Field Calculator - Open field
calculator to update attribute data based on arithmetic, logical and other
calculations
Explore the different tools to understand how each one works.
Tip
Shapefile store attribute data in a separate file with a dbf
extension. This is a widely used GIS database format. You can edit the dbf
file outside QGIS using a spreadsheet application such as MS Office Excel and
OpenOffice Calc, however, caution should be taken in order not to corrupt the
files. Make sure you create a backup before editing the data outside QGIS.
4.2. Creating and editing attributes
We will update the Administrative boundaries layer by adding population for
each barangay for the census year 2010.
1. Open the attribute table by selecting the Administrative boundaries layer
in the Map Legend. Right-click the layer and select
Open Attribute Table.
2. Scroll to the right most end of the table. We will add the population data in
the pop_2010 column. To enable editing in the attribute table, click the
Toggle editing mode. The barangay number are
in the barangay column. Start adding the population of each
barangay.

3. Click again the Toggle editing mode to save
your edits.
4.3. Subset displayed data using table queries
QGIS can also limit the display of features to a subset of your data using attribute queries. It follows the standard Structured Query Language (SQL) used by other applications for managing databases. We will subset our data to display only the barangays within a specific district.
1. Select Administrative boundaries.
Right-click and select Filter...

A new window Query Builder will appear.

2. In the Query Builder, double-click mun_distri in the
Field section, then, click the = in the Operators section, then click
the Sample in the Values section and finally, double-click
Quiapo.

The result will be displayed in the SQL where clause text box as,
"mun_distri" = 'Quiapo'
This SQL simply means that within the mun_distri attribute column, we will select
and display only the district polygons of Quiapo.
3. Click Test. If there are no errors in your SQL, click
OK. The Administrative boundaries should show the subset of
features in your Map View.

4. Style your queried layer showing different colors base on the population for the year 2010.
Note
Editing is disabled when the layer is in filter or query mode. In order to edit the layer, disable the query filter.